background
The following pages (and dynamic sketches) describe another problem we've been investigating in the Banks Lab. Some of the pages contain "sketches" created using the Geometer's Sketchpad, a product of Key Curriculum Press. When you load the first page, applets required to run Sketchpad on your machine must be loaded. Be patient; this may take a few minutes. After the Applet is loaded, each subsequent page will load quickly.
The left side of the sketch is a plan view (top view) of a binocular observer fixating a surface straight ahead. You can vary the surface's curvature by dragging the small dot labeled "Vary Curvature". The large circle is the Vieth-Muller Circle; when the surface is coincident with this Circle, horizontal disparities created by the surface are zero. The right side of the sketch is a stereogram linked dynamically to the plan view. To view the it, position yourself ~30 cm from the display. Cross your eyes such that the left eye is directed toward the small dot in the middle of the concentric boxes on the right and the right eye is directed toward the small dot in the middle of the boxes on the left. When you've done it right, you'll see three sets of concentric boxes; we're interested in the middle one. You should see one vertical blue line in the middle one; if you see two, you're not fusing quite correctly. When you think you've got it, manipulate the surface's curvature by dragging the dot labeled "Vary Curvature". You will see a reasonably compelling sensation of 3-dimensionality as you vary the curvature. The sensation is created by a variety of cues that we examine in the following sequence and examined more thoroughly in the sequence of sketches in Projects labeled "Slant about Vertical Axis".
the device
The sketch below is a plan view (top view) of a binocular observer fixating two surfaces positioned straight ahead. You can vary the distance to one of them by dragging the dot labeled "Vary Distance". As discussed in the sequence of sketches on slant about a vertical axis, we can quantify horizontal disparity by use of the Horizontal Size Ratio. The fixed surface has concave curvature. The observer's lines of sight are represented by the black lines; the eyes' vergence (in radians) is given in the lower right. Horizontal angles in the left eye subtended by the line of sight and the edges of the surface are the angles between the black and green lines; same for the right eye, but between the black and red lines. The two surfaces create exactly the same pattern of horizontal angles at the left and right eyes. As you increase the distance to the movable surface, notice that its curvature first decreases (becoming a plane at one distance) and then changes sign becoming convex. Thus, the same pattern of HSR is consistent with a variety of curvatures depending on the distance to the surface. The point is that surface curvature cannot be recovered from the pattern of horizontal disparities alone.
use of vertical disparities and eye position in estimating surface curvature
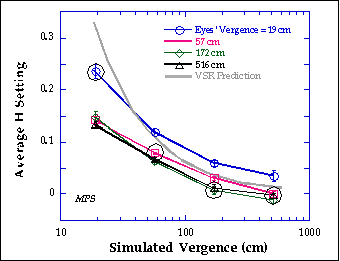
Given that surface curvature can't be determined from horizontal disparities alone, what other signals might be involved? There are two important ones: the eyes' vergence (sensed via extra-retinal signals) and the horizontal gradient of vertical disparity (which can be quantified as derivative of VSR as a function of azimuth). We have recently examined use of these signals by presenting stimuli to observers in which the eyes' vergence and the vertical disparity gradient (simulated vergence) were varied independently (see also Rogers & Bradshaw, 1995). We accomplished this by using the haploscope. The eyes' vergence was varied by rotating the arms of the haploscope in opposite directions. The simulated vergence was varied by manipulating the VSR gradient. The stimulus was a large pattern of random dots. The surfaces were a series of conic sections varying from concave to planar to convex; the curvatures of conic sections can be quantified by the value H (see Ogle, 1950) which corresponds approximately to the horizontal gradient of HSR. Observers adjusted curvature until the surface appeared planar. The data from one observer are shown below. The abscissa is the simulated vergence of the stimulus and the ordinate is the H value when the surface appeared planar. The thick gray curve is the predicted set of H values if observers performed the task veridically based on the VSR gradient. The circled data points are those in which eyes' vergence and simulated vergence were the same ("natural viewing"). The data show that the simulated vergence of the stimulus is a better predictor of observers' settings than the actual vergence of the eyes. Thus, the VSR gradient is an important signal in the estimation of surface curvature.

use of eye position in estimating surface curvature
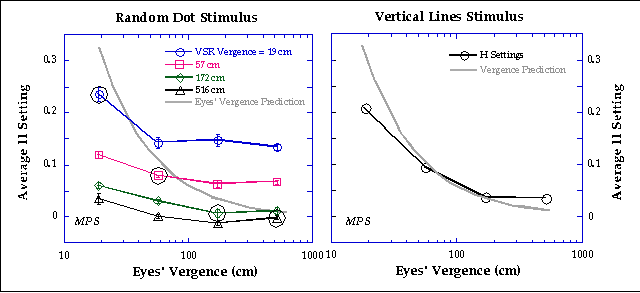
The data from the last page show that the VSR gradient is given more weight than the eyes' actual vergence when a large random dot stimulus is used. What happens if one makes the VSR gradient impossible to measure? We examined this question by using a stimulus composed of long, feature-less vertical lines whose tops and bottoms were clipped at random positions. VSR can't be measured with this stimulus because there are no horizontal contours. We varied the eyes' vergence by rotating the haploscope arms in opposite directions and asked observers to adjust curvature until the surface appeared planar. The data are shown in the right figure below; the abscissa is the eyes' vergence and the ordinate is the H setting. For comparison, the data from the random-dot experiment are shown in the left figure (replotted in the same format as the right figure). The thick gray curves are the predicted H settings if observers performed the task veridically based on the eyes' vergence. (The circled data points on the left are those for "natural viewing".) The data in the right figure show that the eyes' vergence strongly affects perceived curvature when VSR is not measurable. Comparison of the data in the right figure with those in the left, reveals that VSR gradient is a more important determinant when the VSR gradient and eye's vergence are in conflict.


