
background
experiment I and apparatus
One experiment we have performed explores the validity of a model which assumes that the human brain determines the degree to which vision or haptics dominates shape or size percept in a statistically optimal fashion.
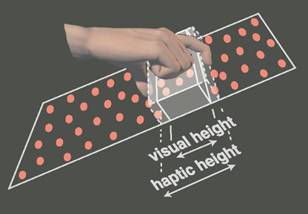
To investigate cue combination quantitatively, we first measured the variances associated with visual and haptic estimation of height. We did this by conducting discrimination experiments in which the observer indicated which of two sequentially presented ridges was taller. One experiment only provided haptic information (observers could only touch the ridge), while the other experiment only provided visual information (observers could only see the ridge). The visually specified height could be made less reliable by adding noise to the stimulus.
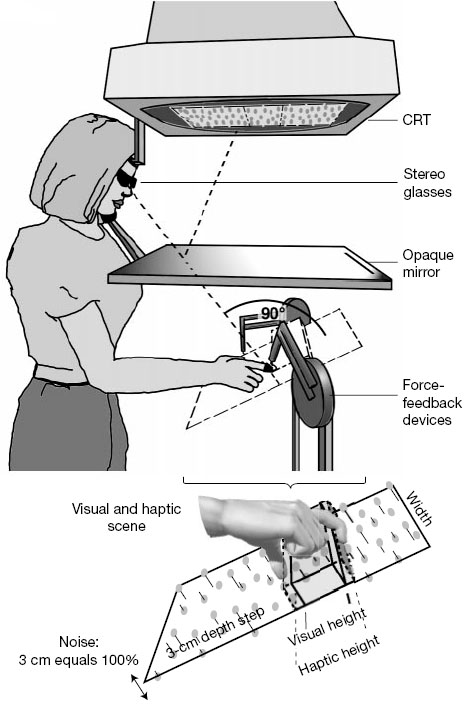
The picture to the left is a schematic of the apparatus we used to study visual-haptic integration. Observers viewed the reflection of the visual stimulus, presented on a cathode ray tube (CRT) binocularly in a mirror. CrystalEyes (StereoGraphics) liquid-crystal shutter glasses were used to present binocular disparity. The surfaces of the stimuli were perpendicular to the line of sight. A head and chin rest limited head movements. The right hand was beneath the mirror and could not be seen. The haptic stimulus was presented with two PHANToM force-feedback devices, one each for the index finger and thumb.
experiment I results
After measuring for variances associated with visual and haptic estimation of height, we performed a similar experiment in which both visual and haptic information were provided. In this experiment, the visually and haptically specified heights were either equal (comparison stimulus), or contradictory (standard stimulus).
Since we had already collected within-modality data, we used this information to predict what an observer using maximum likelihood estimation (MLE) would do when both visual and haptic information are available, and we compared our predictions to subject performance. The shaded area of figure c below shows the predicted weights given to visual information. As you can see, we predicted that less weight would be given to more noisy, and consequentially less reliable, visual information. A change in visual weight means there will be a shift in perceived height. More visual weight shifts perception towards the visually specified height and less visual weight shifts perception towards the haptically specified height. The right ordinate of figure c represents PSE, the comparison height appearing equal to the standard height. As you can see, the empirical data, represented by purple symbols, confirm our weight predictions.
The predicted and observed thresholds are shown in figure d. The dashed red line represents the haptic-alone thresholds. Obviously, performance in this within-modality experiment was not affected by visual noise. The blue, open symbols represent the visual-alone thresholds. As is to be expected, visual thresholds rise with stimulus noise. The shaded area represents our prediction of visual-haptic thresholds, which are always smaller than visual-alone or haptic-alone thresholds at the same noise level. The purple symbols are the empirical data, and, as in figure c, they follow our predictions quite closely. This indicates that human observers may combine visual and haptic information in a manner similar to MLE integration.
Predictions and experimental data. c, Weights and PSEs. Abscissa represents the noise level, left ordinate represents visual weight (haptic weight is 1-visual weight) and right ordinate represents the PSEs relative to Sv and SH. Purple symbols represent observed visual weights obtained from regression analysis of PSEs across Δ. Shaded area represents predicted weights expected from within-modality discrimination; its height represents predicted errors given the standard errors of the within-modality discrimination. d, Combined and within-modality discrimination thresholds. Just-noticeable differences in height are plotted against noise level. Thresholds are taken from psychometric functions. Dashed red line represents haptic-alone threshold; open blue symbols represent visual-alone thresholds; filled purple symbols represent combined visual-haptic thresholds. Shaded area represents predicted visual-haptic thresholds.
experiment II
We conducted another experiment to examine visual-haptic integration. In this experiment, we asked whether the nervous system adjusts the weight given to vision as opposed to touch according to the 3d orientation of an object whose size is being estimated.
We performed two within-modality experiments (either vision-alone or haptic-alone) and an intermodality experiment (both vision and haptics). In the within-modality experiments, the precision of visual estimates varied with surface orientation, but the precision of haptic estimates did not. We predicted than an observer whose perception can be modeled by MLE will combine visual and haptic information weights differently as a function of orientation.
Estimating the Distance between Two Parallel Surfaces. (A and B) For vision, the task is presumably easier on the left (surfaces parallel to the line of sight) than on the right (perpendicular). For touch, the difficulty is presumably similar in the two cases. (C and D) The diagrams below are stereograms depicting the visual stimuli. To view them, converge or diverge the eyes.
experiment II results
For the intermodality experiment, two 750-ms stimuli were presented to the observer: A no-conflict stimulus for which visual and haptic information agreed and a conflict stimulus for which visual and haptic information contradicted each other. Results of this experiment are shown below. Figures A-C show the proportion of trials in which the no-conflict stimulus was judged as larger than the conflict stimulus for different conflict pairings. As you can see in A and C, estimates shift towards visually indicated intersurface distance in the parallel conditions, and they shift towards haptically indicated intersurface distance in the perpendicular conditions. Figure D shows the same effect. These shifts are consistent with our prediction that vision will dominate the judgment when the visual variance is lower than the haptic variance and that the reverse will occur when the visual variance is higher.
Results of the Itermodality Experiment. (A-C) The proportion of trials in which the no-conflict stimulus was judged as larger than the conflict stimulus is plotted as a function of the intersurface distance in the no-conflict stimulus. The data have been averaged across observers. (A), (B), and (C) show the data for conflict pairings (visual-haptic_ of {47, 53}, {50,50}, and {53, 47} mm, respectively (3 of the 7 conflicts). The red, green, and blue symbols are data from the parallel, oblique, and perpendicular conditions, respectively. PSEs are the values of the no-conflict stimulus for which the observer reports that it is larger than the conflict stimulus half the time. Those values are indicated for the parallel, oblique, and perpendicular conditions by the red, green, and blue arrows, respectively.(D) Predicted and observed PSEs plotted as a function of the visually specified distance (lower abscissa) or haptically specified distance (upper abscissa) in the conflict stimulus. The diagonal gray lines show the predicted PSEs if vision or haptics completely dominated the combined percept. PSEs predicted by the ML combination rule are represented by the colored lines (derived from the within-modality data averaged across observers). The circles represent the observed PSEs, averaged across observers.