. |
 .
.
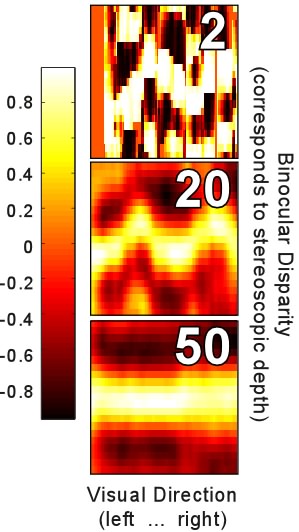
Output of Binocular Cross-correlator
The input is a random-dot stereogram (two monocular images, 512 X 512 pixels each) depicting a surface whose depth varies sinusoidally across spatial location. (A demonstration is available here.)
The three panels represent the top view of model's outputs for three sizes of cross-correlation window. (Window sizes in pixels are shown in each panel.) The colors represent correlation values, explained in the color bar.
Summary:
- In the middle panel the model recovers the corrugation well: Correlation values are high at locations that repeat the corrugation shape.
- In the top panel the cross-correlation window is too small to capture a unique luminance pattern at every location. As a result, the model detects many false binocular matches (matching noise).
- In the bottom panel the window is too big: it blurs the signal.
Thus, there exists an optimal size of cross-correlation window which minimizes both matching noise and blur. The highest spatial resolution (i.e., the smallest perceptible variation in depth) is determined by the smallest window size, for which the output signal still stands out in matching noise.