Visual-haptic Ideal Observer
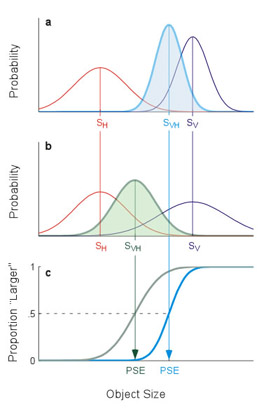
a and b: The red curves represent distributions of haptic estimates and the purple curves distributions of visual estimates; the variance of the visual estimate is greater in b than in a and the variance of the haptic estimate is the same.
The distributions associated with optimal combination are derived from the maximal likelihood estimator (MLE); these are the blue and green shaded curves in a and b, respectively. The combined estimate is closer to the visual estimate in a, but closer to the haptic estimate in b.
Note that in both a and b the distributions of combined estimates are narrower than the distributions of visual or haptic estimates, i.e., combined estimates are more precise than the within-modality ones.
c: Observers compare the sizes of two stimuli: one with inconsistent visual and haptic information (as in a or b) and one with consistent information (not shown). The psychometric functions plot the proportion of trials in which one stimulus is judged as larger than another. Psychometric functions for optimal integration can be derived from the combined distributions (shaded curves) in a and b.
The point of subject equality (PSE) is the value of object size for which the observer responds with equal probability that the one stimulus is larger or smaller than the other. In other words, PSE corresponds to the perceived size of the stimulus in which visual and haptic cues are inconsistent. The PSE is closer to the visual estimate when the visual variance is low, but closer to the haptic estimate when the visual variance is high.